Sales-Analysis
Sales Analysis by Country, Item and Color (Excel PivotTables)
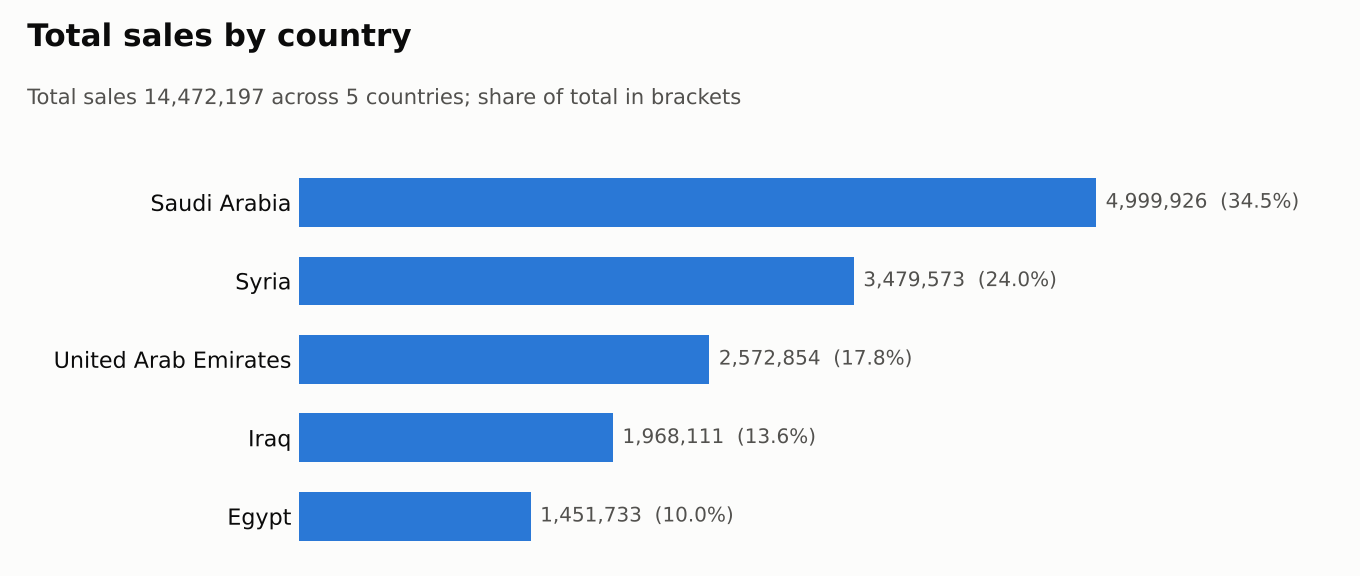
An Excel PivotTable analysis of 7,902 units and 14.47M in total sales across 5 countries, 14 items and 26 colors. Saudi Arabia and Syria generate almost 59% of sales, and Tie and Jeans lead in every country.
🎯 Business Question
Where do sales come from, and which products drive them? Specifically:
- Which countries generate the most sales?
- Which items sell best, overall and in each country?
- Which colors are the best sellers?
📁 Data
- Source: Sales data used in a data analysis course assignment
- Size: 7,902 units sold, 482 country / item / color combinations
- Countries: Saudi Arabia, Syria, United Arab Emirates, Iraq, Egypt
- Items (14): Tie, Jeans, Bag, T-Shirt, Suit, Belt, Shoes, Coat, High Heel Shoes, Hat, Wallet, Dress, Skirt, Glasses
- Measures: Sum of Quantity, Total Sales
🛠️ Tools
Microsoft Excel: PivotTables with slicers
🔄 Process
- Organized the data by country, then item, then color.
- Built PivotTables showing Sum of Quantity and Total Sales for each combination.
- Summarized total sales per country and per item to compare performance.
- Checked the totals: the country and item summaries add up to the pivot’s grand total of 14,472,197 in sales and 7,902 units.
🔍 Key Findings
- Saudi Arabia and Syria generate 58.6% of total sales. Saudi Arabia leads with 4,999,926 (34.5%), followed by Syria with 3,479,573 (24.0%).
- Egypt is the smallest market at 1,451,733 (10.0% of sales), and it also has the lowest average sales per unit (about 1,702, compared with about 1,831 overall).
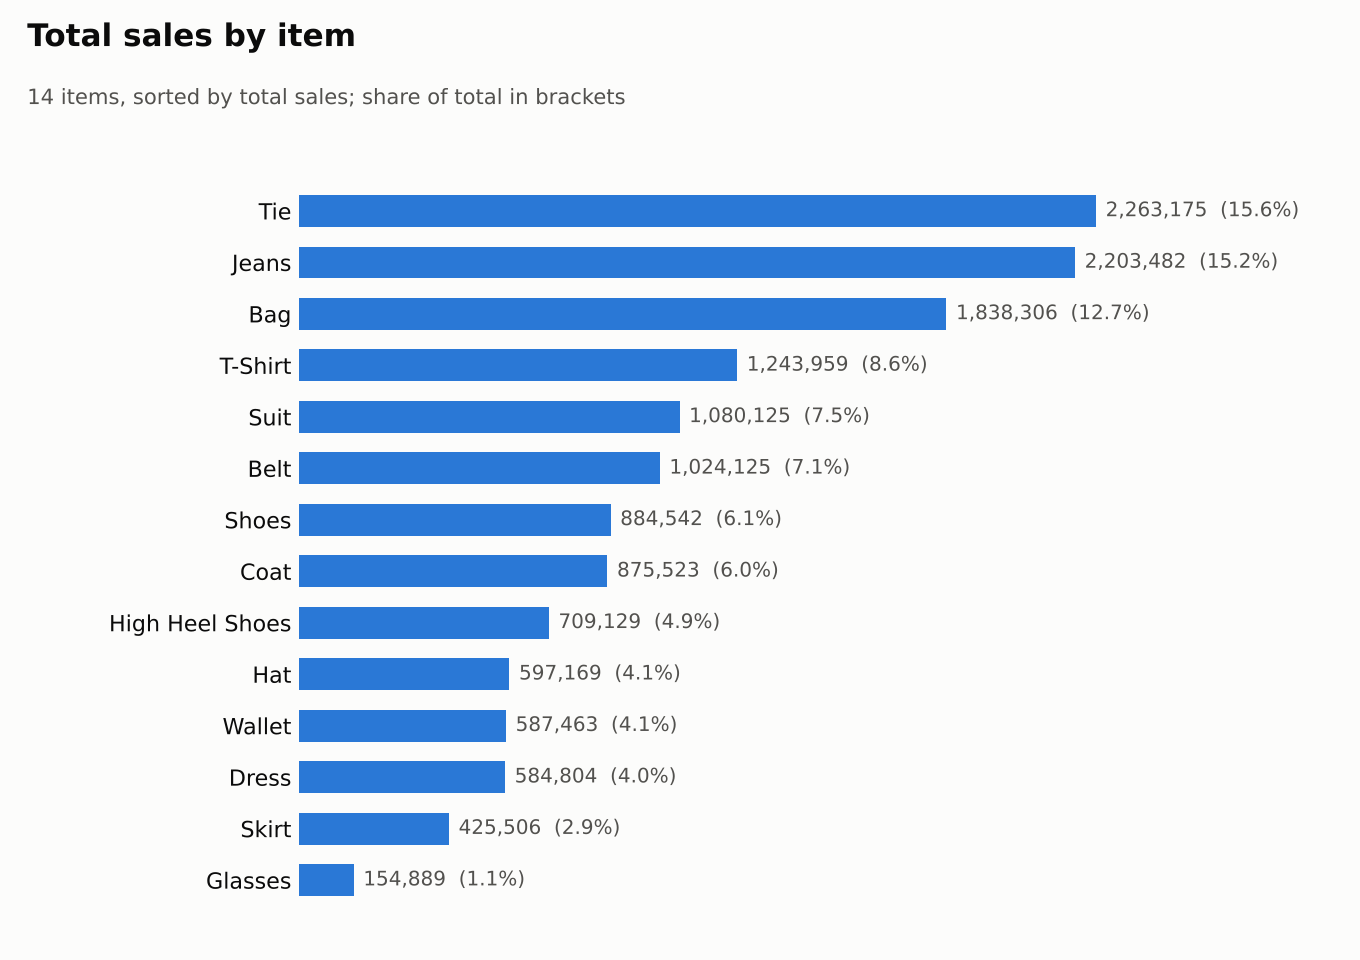
- Three items make up 43.6% of sales. Tie (2,263,175), Jeans (2,203,482) and Bag (1,838,306) lead all 14 items.
- Tie or Jeans is the #1 item in every country. Tie leads in Egypt, Iraq and the UAE, and Jeans leads in Saudi Arabia and Syria.
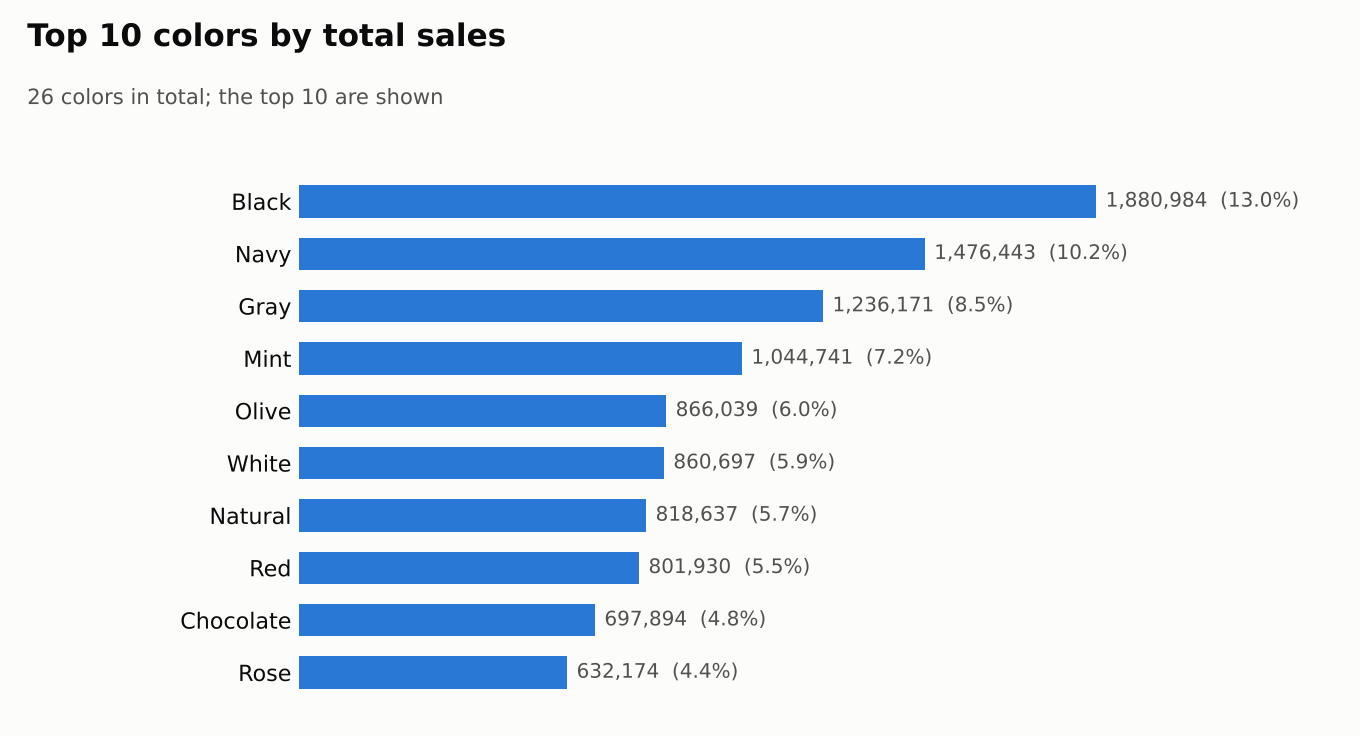
- Neutral colors dominate. Black (13.0%), navy (10.2%) and gray (8.5%) together account for 31.7% of sales.
- Glasses are the weakest item at 1.1% of sales (154,889) and sold in only one color (indigo).
✅ Recommendations
- Prioritize Saudi Arabia and Syria in stock planning and marketing, since they drive most of the revenue.
- Always keep Ties, Jeans and Bags well stocked as the best sellers, and keep black, navy and gray options available.
- Investigate Egypt’s low average sales per unit (pricing, product mix or discounting) before deciding whether to grow or hold that market.
- Review the slowest items (Glasses, Skirts) to decide whether to widen their color range or reduce stock.
📂 Files
workbook/sales-pivot-analysis.xlsx– the Excel workbook with the PivotTablesimages/– charts used in this README
👤 Author
Mohamed EL Maghawry · LinkedIn · maghawry.17@gmail.com